Public Health Guidance for Reopening
The Alabama Department of Public Health (ADPH) is using data and metrics to make recommendations to assist the Governor’s Office, partners, and stakeholders across the state in making decisions about safely reopening Alabama. COVID-19 remains very contagious and our data and metrics tell us that we should continue to take preventative measures to protect ourselves and our communities and reduce the spread of COVID-19.
We are committed to continuing to do the work to protect the health and safety of Alabamians by giving guidance based on the best science and public health practices available. We will continue to maintain and update the statewide data and metrics and provide consistent localized data for use in local decision-making for reopening plans.

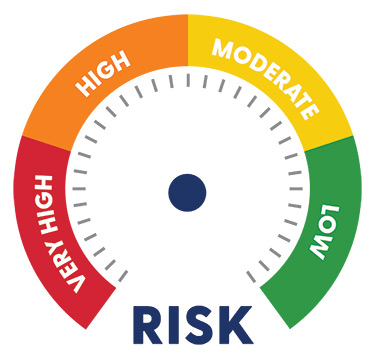
Risk Categories
A color-coded health guidance system has been developed by the State of Alabama to guide health behaviors for individuals and businesses. Categories: Very High (red), High (orange), Moderate (yellow), and Low (green) indicate the risk of spread in the community. Each level of the dial is guided by a rigorous measurement system which can be different by county.
High-risk individuals in the red risk category, including older adults and those who are immunocompromised, should continue to follow stricter protocols, and exercise all possible caution. Individuals who work or live with persons in high-risk categories should also continue following stricter guidance.
Find out your county’s risk category using our COVID-19 Risk Indicator Dashboard. Shortened Link: arcg.is/045191. Mobile Version Shortened Link: arcg.is/0ee50W.
Dashboard Data Source: ADPH Infectious Diseases & Outbreaks Division using the Alabama NEDSS Base System (ALNBS), our disease reporting and surveillance system.
Data on the dashboard are updated on Fridays. All data are provisional and subject to change. Data are lagged by five days to allow for completeness in reporting. These data can change on a daily basis as new information about cases is gathered or updated, which means the gating criteria status could change from red to green and back to red.
Current Status of Alabama’s 67 Counties
As of June 30, 2020, here’s the status of Alabama’s counties:
Low Risk (Green) Category [5]: Colbert, Crenshaw, Geneva, Hale, Lowndes
Moderate Risk (Yellow) Category [19]: Bullock, Butler, Chambers, Choctaw, Clay, Dale, Fayette, Franklin, Houston, Limestone, Macon, Marengo, Monroe, Montgomery, Morgan, Pike, Sumter, Walker, Washington
High Risk (Orange) Category [19]: Bibb, Blount, Cleburne, Coffee, Conecuh, Covington, Greene, Henry, Jefferson, Lamar, Lauderdale, Mobile, Perry, Pickens, St. Clair, Talladega, Tallapoosa, Tuscaloosa, Wilcox
Very High Risk (Red) Category [24]: Autauga, Baldwin, Barbour, Calhoun, Cherokee, Chilton, Clarke, Coosa, Cullman, Dallas, DeKalb, Elmore, Escambia, Etowah, Jackson, Lawrence, Lee, Madison, Marion, Marshall, Randolph, Russell, Shelby, Winston
Download Risk Indicator Table and Map: 7/1
Phased Guidelines for the General Public and Businesses
- Low Risk (Green) Phase Guidelines
- Moderate Risk (Yellow) Phase Guidelines
- High Risk (Orange) Phase Guidelines
- Very High Risk (Red) Phase Guidelines


How Risk Categories Are Assigned
Calculations for each county’s risk of COVID-19 spread in the community is based on number of new cases each day. To better represent when the person could potentially spread the disease, the “case date” is calculated based either on the date of specimen collection or symptom onset, depending on which date was first. These factors were chosen because they are not subject to reporting delays. If both specimen collection date and onset date are not available, case date is determined through either the date the test was entered into the lab system or the date the public health investigation of the case was initiated. Once again, we use the earliest date, to determine case date. The number of new cases each day is calculated with a rolling 3-day average to account for fluctuations in reporting.
Metric: Declining New Cases
Our main indicator for limiting the risk of COVID-19 spread in the community is the number of days a county has a downward trend of new cases each day. Whether the case counts are increasing or decreasing influences a county’s level (e.g., low risk). In determining the trajectory of cases, there is a five-day grace period, meaning that each county can have up to five days with an increase in new cases in a 14-day window before they are considered to not be in a downward trajectory. The ourpose of the five-day grace period is to account for minor fluctuations that do not truly change the downward trend in cases.
- If the number of cases is staying the same or is increasing, the category will be Very High Risk (Red).
- If a county has decreasing case counts for 1 to 6 days, they will begin in the High Risk (orange) category.
- If a county is in a downward trajectory of 7-13 days, they will begin in the Moderate (yellow) category.
- If a county is in a downward trajectory of 14 or more days, they will begin in the Low Risk (green) category.
Several factors can influence a county’s trajectory of COVID-19 cases, so other factors are examined to additionally inform which level a county should be in.
Metrics: Percent Positive Declining and Testing Goals Met
Confidence in trends is dependent upon testing volume within the county, the second measure. Adequate testing is considered to be at least 0.8% of a county’s population every two weeks (or about 2% per month). The timeline of two weeks is designed to ensure that counties provide testing opportunities for their citizens regularly, with the consideration that some weeks may not be conducive to high test rates (i.e., holidays). If a county meets the measure of at least 0.8% of its citizens being tested over the most recent 14-day period, the county remains in the same level as the initial assessment above. If fewer than 0.8% of the population was tested, then the county will move up one level (i.e., low to moderate). The percentage of positive tests is also taken into consideration, with the goal being a significant decrease in the percentage positive and/or less than 10% of people tested resulting in a positive test result. If a county fails this measure but passes the measure to test 0.8% of the population, it will still move up a level as this indicates a potentially higher percentage of persons with COVID-19. If a county fails both measures, it will still only move up one level. If a county passes both measures, it will remain at the same level.
Metric: Visits for Covid-Like Symptoms Declining
The third factor to be considered at this time is trends in the percent of visits that are people presenting with COVID-like symptoms in emergency rooms or urgent care clinics. This measure is designed to detect residents of the county with COVID-19 who may not be tested for various reasons. If a county has a decreasing number of people presenting in with COVID-like symptoms, or if the number of people presenting with COVID-like symptoms remains stable or is fewer than 10 over a 12-day period, the county will remain at the same level. If the number of people presenting with COVID-like symptoms in urgent healthcare settings is significantly increasing, then the county moves up a level.
Resources for Reopening
For entities deciding on whether or not to reopen, the Centers for Disease Control and Prevention (CDC) has decision tools to assist you in making reopening decisions regarding Workplaces, Child Care, Schools, Institutes of Higher Education, Aquatic Venues, Summer Camps, Youth Sports, and Mass Transit.
For businesses that are reopening, ADPH and the Office of the Governor have created these flyers related to the past three amended Safer at Home Orders:
- Guidelines for Safeguarding All Businesses (Spanish version)
- Guidelines for Athletic Facilities (Spanish version)
- Guidelines for Close Contact Personal Service Businesses (Spanish version)
- Guidelines for Places of Worship (Spanish version)
- Guidelines for Restaurants and Bars (Spanish version)
- Guidelines for Entertainment Venues and Tourist Attractions (Spanish version)
- Guidelines for Day and Overnight Youth Summer Camps (Spanish version)
- Guidelines for Child Day Care Facilities (Spanish version)
- Guidelines for Adult and Youth Athletic Activities (Spanish version)
- Checklist and Guidelines for School-Sponsored Activities (Alabama State Department of Education)